
Guide to Key Candlestick Patterns in Trading
📈 Explore key candlestick patterns 🔥 Single, double & triple forms explained 🔍 Spot trends & make smarter trading moves in Nigeria's markets today!
Edited By
Hannah Collins
Candlestick patterns have become a cornerstone in technical analysis, especially for traders and investors seeking to read market movements clearly. These patterns offer a simple visual tool to spot potential trend reversals or continuations, making them invaluable for smart trading decisions. Unlike random guesses, candlestick patterns provide concrete signals that help you plan your trades more efficiently.
The roots of candlestick charting trace back to Japan’s rice markets in the 18th century. Since then, this method has crossed borders and gained global acceptance due to its clarity and effectiveness. Nigerian traders can especially benefit from understanding these patterns as they apply to local markets like the Nigerian Stock Exchange (NGX), forex platforms, and commodity trading.
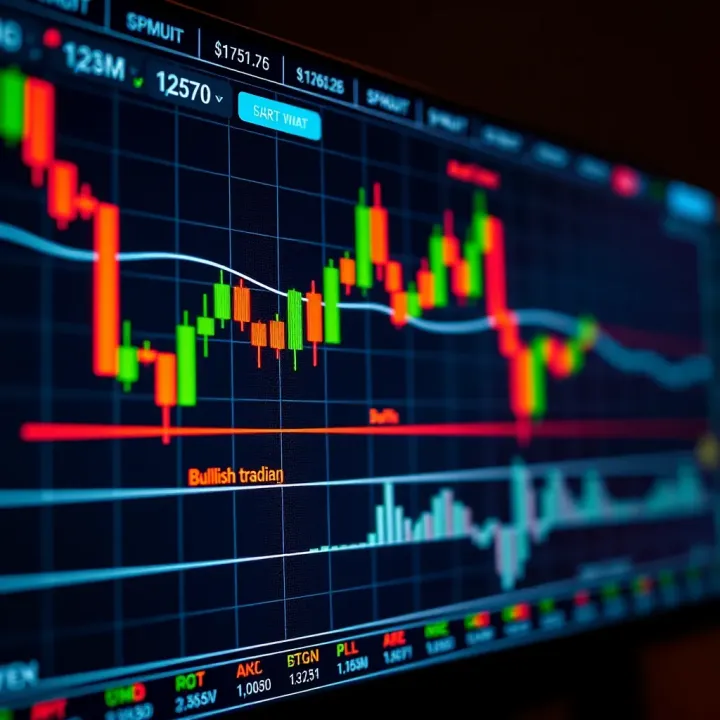
Understanding candlestick patterns involves recognising their components—open, close, high, and low prices for a given time frame. Each candle tells a story: a bullish candle suggests buyers are in control, while a bearish one shows sellers taking charge. Combining these candles in patterns helps predict what might come next.
Mastering these patterns allows you to spot early signals, reducing guesswork and improving your timing for entries and exits.
Some common candlestick patterns you should watch for include:
Doji: Signals indecision; a balance between buyers and sellers.
Hammer and Hanging Man: Indicate potential reversals at bottoms or tops.
Engulfing Patterns: Strong reversal signals when a candle fully covers the previous one.
Morning Star and Evening Star: Show shifting momentum in the market.
For Nigerian traders, applying these insights to NGX-listed stocks or forex pairs like USD/NGN can improve trade precision. For example, spotting an Engulfing pattern on a blue-chip stock chart may signal a good entry point ahead of an upward move.
To use candlestick patterns effectively:
Combine with other indicators such as moving averages or RSI to confirm signals.
Understand market context—patterns in volatile ember months may behave differently.
Always manage risk; patterns aren’t guarantees but guides.
Being familiar with candlestick patterns equips you with a practical, visually intuitive method to anticipate price actions. This foundation is key before moving on to details about specific patterns and strategies for smart trading in Nigeria’s fast-evolving markets.
Candlestick patterns serve as an essential tool for traders and investors who want to understand market movements better. Unlike plain price charts, candlesticks offer a visual snapshot of how prices have moved during a specific period. This makes it easier to spot trends, reversals, and potential entry or exit points. For instance, a hammer pattern after a price drop could signal a possible rebound, which is invaluable in decision-making.
Candlestick patterns are formations created by one or more candlesticks on a price chart. Each candlestick summarises price activity for a set period—be it a minute, an hour, or a day—showing the open, close, high, and low prices. Traders look for particular arrangements of these candlesticks that suggest future price changes. For example, a doji candle, where the open and close are nearly the same, often indicates market indecision and may precede a trend shift.
The technique of using candlestick charts originated in Japan during the 18th century, pioneered by a rice trader named Munehisa Homma. He noticed that the psychology of market participants could be reflected in the shapes formed by price movements. This method gained global acceptance after being introduced to Western markets in the late 20th century, adding a practical layer to technical analysis that traditional bar charts lacked. Today, traders across the world, including Nigeria, rely on candlestick charts for quick and precise market readings.
Candlestick patterns reveal the tug-of-war between buyers and sellers, providing clues about market momentum and sentiment. Using these patterns helps traders make informed choices, whether entering or exiting trades. In the Nigerian stock market, where volatility can be sharp due to factors like naira fluctuations, political shifts, or global commodity prices, candlestick signals offer a timely edge. They also complement other tools like moving averages and support/resistance analysis, making the trading approach more comprehensive and less risky.
Understanding candlestick patterns empowers you to read beyond mere numbers and spot opportunities that may otherwise go unnoticed in fast-moving markets.
By mastering the basics of candlesticks, Nigerian traders position themselves better to react swiftly in the local and forex markets, enhancing their chances for profitable trades.
Understanding how to read candlestick charts is fundamental for any trader aiming to make informed decisions. These charts offer a visual summary of price movement over a set time and help detect market sentiment quickly. For Nigerian traders dealing with stocks, forex, or commodities, mastering this skill can reduce guesswork and improve timing.
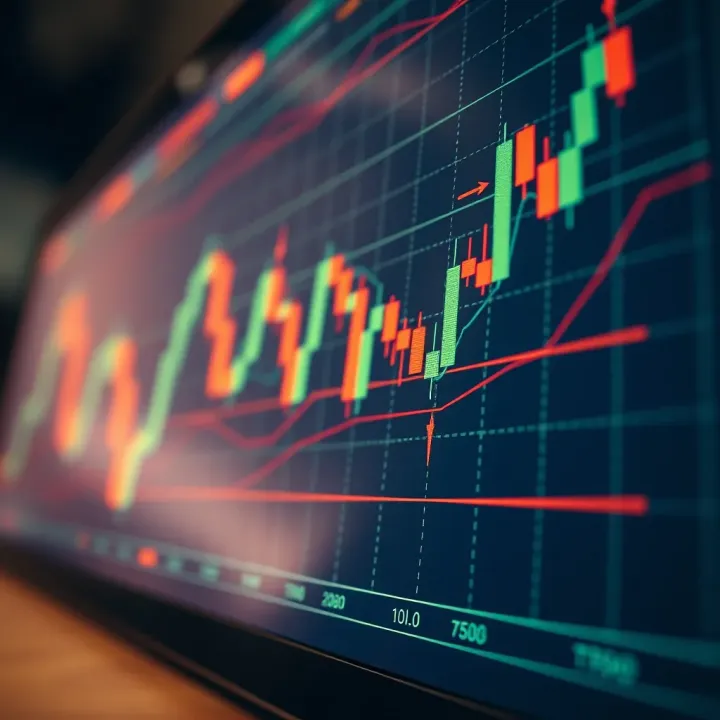
The body of a candlestick represents the price range between the opening and closing prices during a specific period. If the close is higher than the open, the candle is typically bullish, signalling buying pressure. Conversely, if the close is lower than the open, the candle is bearish, showing selling pressure. For example, a stock on the Nigerian Stock Exchange (NGX) opening at ₦250 and closing at ₦280 in one day would form a bullish candle, indicating market optimism.
This body size reveals the strength of price movement. A long body shows strong momentum, while a short body suggests indecision or weak activity. Nigerian traders often combine this with volume data to confirm whether the market move is genuine or just a small blip.
The wicks, also called shadows, stretch from the ends of the body to the highest and lowest prices during the period. These show how far price has travelled beyond the opening and closing points. Long upper wicks signal sellers pushed prices down after an attempt to rally, while long lower wicks indicate buyers stepped in to push prices up after a drop.
For instance, a forex pair like USD/NGN might close near its opening price but display long lower wicks during the day, suggesting buyers are defending the pair even amid volatility. This can hint at a possible price bounce. Nigerian traders watch these wicks closely because they expose hidden battle zones between bulls and bears.
Bullish candles reflect upward price movement, a sign that buyers controlled the market during the time frame. They appear green or white in many charts but can be customised. Bearish candles show downward movement, meaning sellers dominated. Recognising this allows traders to gauge current mood quickly without reading raw numbers.
Using candlestick colour and shape together helps identify market turns and momentum changes. A series of bullish candles might suggest an uptrend, but a sudden bearish candle could warn of reversal. Nigerian traders often combine candlestick signals with broader economic news, such as CBN interest rate decisions, to avoid falling for false alarms.
Candlestick charts come in different time frames—minutes, hours, days, or weeks—each offering distinct trading insights. Day traders in Lagos might focus on 5-minute or 15-minute charts for short-term moves, while investors in agricultural stocks may prefer daily or weekly candles to assess trends.
Adjusting chart settings like time frame can reveal different patterns. For example, a hammer candle on a 1-hour chart may suggest short-term buying interest, while the same pattern on a daily chart points to longer-term support. Nigerian traders should select time frames aligned with their trading style and use consistent settings to avoid confusion.
Understanding these candlestick elements and their interpretation equips you to read price actions effectively. This knowledge, when paired with local market awareness, can make trading a sharper, more calculated exercise.
Understanding common candlestick patterns is vital for traders aiming to make smart decisions in the market. These patterns offer insights into market sentiment and potential price movements, helping you anticipate trend reversals or continuations. By recognising these visual signals, Nigerian traders can better time entries and exits, reducing risks in volatile markets like the NGX or forex pairs such as USD/NGN.
A Doji forms when a candlestick has almost identical opening and closing prices, resulting in a very small body and longer wicks. It signals indecision between buyers and sellers. In practice, a Doji appearing after a strong uptrend or downtrend suggests the momentum might be fading and a reversal could be near. For example, if shares of a Nigerian tech company show a Doji after days of price rise, it could warn investors that bullish strength is weakening.
The Hammer and Hanging Man look similar but appear in different contexts. A Hammer occurs at the bottom of a downtrend with a small body and a long lower wick, indicating buyers are pushing prices up despite initial selling pressure. Conversely, the Hanging Man appears after an uptrend, signalling potential weakness as sellers test the market. Traders often watch these patterns for opportunities to enter or exit positions, such as when commodity prices on the Lagos market hint at a turnaround.
A Shooting Star has a small body, a long upper wick, and appears after a bullish run. It shows that although buyers pushed prices higher during the session, sellers regained control by the close. This pattern warns of a possible bearish reversal. For instance, if a bank stock listed on the NGX forms a Shooting Star after several green candles, investors might tighten stop-loss orders or consider taking profits.
The Engulfing Pattern involves two candles where the second fully covers or "engulfs" the first one's body. A Bullish Engulfing appears at a downtrend's end, signalling buying pressure, while a Bearish Engulfing at an uptrend's peak hints at selling pressure. Nigerian traders often spot this pattern to confirm momentum shift, making entry or exit decisions more reliable.
These are three-candle patterns indicating strong reversals. The Morning Star starts with a bearish candle, followed by a small-bodied candle showing indecision, then a bullish candle that closes well into the first candle's range. It forecasts a bullish turnaround. Conversely, the Evening Star signals a bearish reversal with an inverse sequence. This pattern is useful in markets like forex, where timings are crucial, such as before the Central Bank of Nigeria's policy announcements.
"Three White Soldiers" consists of three consecutive long bullish candles, each closing higher, confirming strong buying interest. Meanwhile, "Three Black Crows" are three successive bearish candles, signalling a clear sell-off. These patterns are especially helpful in confirming trend strength or exhaustion on daily charts for Nigerian equities or commodities.
Recognising these candlestick patterns improves timing and market understanding, which can make the difference between profit and loss. Always combine them with volume analysis or support and resistance levels for robust trading strategies.
Candlestick patterns remain a practical tool for analysing trends in Nigerian stock and forex markets. They help traders make informed buy or sell decisions by revealing shifts in market sentiment quickly and visually. Given the volatility of Nigerian markets, particularly the frequent swings in equity prices and the forex naira/dollar rates, understanding these patterns can give you an edge over less prepared participants.
In the Nigerian Stock Exchange (NSE or NGX), price movements can be sharp due to factors like earnings reports, government policy announcements, or global commodity price changes. For example, a bullish engulfing pattern on the shares of a major bank like GTBank after a favourable Central Bank of Nigeria (CBN) policy could signal a strong upward move worth capitalising on.
Similarly, in the forex market, candlestick patterns offer useful clues amid the naira's fluctuations against the US dollar or other currencies. Traders watching for reversal signals like the hammer or shooting star can position themselves well when the naira stabilises after sharp depreciations, especially given the impact of fuel shortages or forex restrictions on currency demand.
Moving Averages: These smooth out price data to help identify trends. Nigerian traders often use short-term (like 10-day) and long-term (50 or 200-day) moving averages alongside candlestick patterns. When the price crosses above a moving average, coupled with a bullish candlestick pattern, it often confirms an uptrend. For instance, if a Konga share price breaks above its 50-day moving average with a morning star pattern forming, it suggests buying momentum is gaining strength.
Volume Analysis: Volume shows how many shares or contracts have traded within a time frame, providing insight into the strength behind a price movement. In Nigeria, where liquidity can vary significantly by stock, volume spikes accompanying bullish patterns, like engulfing candles, confirm strong market interest. If volume is low, even a strong-looking pattern could fail. So, for forex pairs like USDNGN, watching volume (or traded lot sizes) helps verify if a candlestick formation signals a true trend change.
Support and Resistance Levels: These price points act like floors and ceilings where buying or selling interest is strong. Candlestick patterns near these levels are especially significant. For example, a hammer forming just above a well-established support level in the NSE suggests the market tested the downside but buyers stepped in aggressively. Pairing candlestick signals with these levels refines entry and exit points, reducing risky guesses.
Successful Nigerian traders often weave candlestick patterns seamlessly with tools like moving averages and volume analysis to avoid false signals and improve timing.
Always check the market context and news since economic or political developments can override technical signals. For example, CBN’s monetary policies or election outcomes affect market direction seriously.
Use multiple time frames; spotting a morning star pattern on a daily chart confirmed on a weekly chart provides stronger confidence.
Never rely solely on candlestick patterns. Combine them with fundamentals or indicators to manage risks better.
Manage your risk carefully given Nigeria's market unpredictability—set stop-loss orders based on recent support levels or average price volatility.
Practice with smaller positions while you learn, especially in forex trading where leverage amplifies both gains and losses.
Candlestick patterns are not magic but powerful when understood well and combined with other tools. Nigerian investors who learn to read these signs can trade more smartly amid local market ups and downs.
When trading using candlestick patterns, recognising common mistakes can save you from costly errors. These mistakes often stem from misunderstanding patterns or neglecting other crucial market factors. Avoiding them boosts your chances of making smarter, more profitable decisions.
Focusing solely on candlestick patterns without considering other indicators is a common trap. Patterns can suggest possible market direction, but they don't guarantee outcomes. For example, relying just on a morning star pattern without checking volume or broader trend might lead you into a fading rally that collapses soon after. Traders in Nigerian markets sometimes fall into this by chasing quick wins from popular patterns, ignoring signals like moving averages or support and resistance zones. Always pair candlestick signals with other tools for confirmation before entering a trade.
Candlestick patterns don’t exist in a vacuum. External news, economic events, or market sentiment affect price moves. For instance, during fuel subsidy removal announcements or CBN monetary policy changes, markets can behave erratically, negating typical pattern signals. Nigerian traders must watch headlines closely, especially during ember months when market volatility tends to spike. Using a hammer pattern to buy without considering upcoming quarterly earnings or geopolitical tensions can backfire. Combine pattern analysis with current events to avoid being blindsided.
Even the best pattern signals fail if risk is poorly managed. Many traders overlook stop-loss placement or overexpose their capital on one trade. Suppose you spot a bullish engulfing pattern forming on an NSE-listed stock. Jumping in without calculating the right stop-loss or position size can wipe out gains when the pattern fails. Good risk management means setting clear exit points and never risking more than a small percentage of your capital per trade. Nigerian investors should remember that market shocks, like sudden naira volatility or power supply issues, can cause swift price drops. Protect your portfolio with sensible risk strategies.
Avoid these mistakes to sharpen your trading edge and build a solid foundation for consistent profits.
Taking these points seriously will help you not just spot patterns but use them wisely in real trading conditions.
📈 Explore key candlestick patterns 🔥 Single, double & triple forms explained 🔍 Spot trends & make smarter trading moves in Nigeria's markets today!
📊 Master 35 key candlestick patterns every trader needs! Learn how to spot trends, read signals, and trade smarter in any market condition. 📈
📈 Learn key bullish reversal candlestick patterns every Nigerian trader should know. Spot market upswings in equities, forex, and commodities for smart entry points today!
📈 Learn how reversal chart patterns signal price trend shifts in trading. Spot these patterns easily and boost your strategy for smart market moves in Nigeria and beyond.
Based on 10 reviews