

Understanding Forex Chart Patterns in Nigeria
📊 Discover how forex chart patterns work in Nigeria's market! Learn to spot trends, manage risks, and use handy PDFs for confident trading moves. ₦ gains await!
Edited By
Amelia Clarke
Every trader in Nigeria knows how fast markets can move, especially with the naira's ups and downs and the frequent power supply challenges shaking economic activities. Spotting bullish chart patterns gives you a better chance to catch price rises rather than chasing after them blindly. These patterns provide clear signals that an asset, whether on the Nigerian Stock Exchange (NGX) or even in the forex market, may soon experience upward movement.
Understanding bullish patterns is more than just recognising shapes on a screen. It's about reading market psychology through price action to decide when to enter or exit trades. For example, if you identify a double bottom—a classic bullish pattern—it shows sellers possibly losing control, and buyers could be preparing to push prices higher. Such insights help you avoid unnecessary losses and capitalise on the right moments.

In Nigerian markets, where liquidity can sometimes be thin and volatility high, combining chart patterns with other tools like volume analysis, moving averages, and economic news ensures more reliable decisions. For instance, spotting a bullish breakout on a stock like MTN Nigeria or Dangote Cement, alongside increased trading volume and positive earnings reports, strengthens your confidence in going long.
Bullish chart patterns offer practical clues, but relying solely on them without context is risky. Always cross-check with market fundamentals and risk management strategies.
Here are key points to keep in mind when working with bullish patterns:
Learn the common patterns: cup and handle, ascending triangle, bullish flag, and others.
Watch for confirmation signals like volume spikes or candlestick closes above resistance.
Adapt your strategy to local market quirks, such as price gaps due to announcements or central bank policy shifts.
Remember, no pattern guarantees profit—manage your stop-loss and target levels carefully.
By mastering these patterns alongside Nigerian market dynamics, you boost your trading edge and improve your chances of growing your ₦ investment steadily and sensibly.
Bullish chart patterns are specific price formations on stock or forex charts that indicate a potential rise in an asset’s price. For traders operating in Nigerian markets, spotting these patterns early can be the difference between making profitable buys and suffering losses. Understanding these formations helps you anticipate upward trends rather than simply reacting to market moves after they happen.
Bullish chart patterns emerge from the collective buying and selling actions of market participants. They often reflect shifts in sentiment—from pessimism or indecision to optimism. A common characteristic of these patterns is a series of higher lows or a breakout above a resistance level, signalling that buyers are gaining control. These formations come in various shapes such as ascending triangles, cup and handle, or double bottoms, each with distinct features but united by the expectation of price increase.
For example, consider the Ascending Triangle on the Nigerian Stock Exchange (NGX) where the price repeatedly bounces off an upward-sloping support line while facing a flat resistance. Such a pattern often precedes a bullish breakout, useful for traders watching stocks like Dangote Cement or Guaranty Trust Bank (GTBank).
Bullish chart patterns provide practical signals for entry and exit points. When you identify a reliable pattern, it often indicates an opportune moment to buy, ideally before a price surge. Many Nigerian traders use these patterns alongside volume analysis—rising volumes can confirm the strength of the pattern.
For instance, if a double bottom forms on the chart of a forex pair like USD/NGN, and is accompanied by increasing trading volumes, it suggests buyers are stepping in, making it a potential entry point. On the other hand, disregarding these patterns can expose traders to sudden price reversals.
Recognising and acting on bullish chart patterns helps traders reduce guesswork and structure their strategies around clear market behaviour instead of gut feelings.
Since local markets can be volatile—owing to factors like naira fluctuations or policy changes—combining these patterns with other tools such as support/resistance levels and risk management safeguards your investments. This approach helps you make data-informed decisions rather than emotional guesses.
In short, mastering bullish chart patterns offers Nigerian traders a practical edge in anticipating price rallies, managing risk, and increasing potential returns throughout the markets where they operate.
Recognising common bullish chart patterns helps traders make sense of price movements and plan their trades effectively in Nigerian markets. These patterns signal potential upward trends, providing clues about when to enter or exit trades. Having a clear grasp of patterns like the Ascending Triangle, Cup and Handle, Double Bottom, and Inverted Head and Shoulders can improve your timing and increase your chances of profit. Let’s explore what sets each pattern apart and their practical use.
The Ascending Triangle forms when price hits a horizontal resistance level repeatedly but makes higher lows, shaping a rising support line. This pattern reflects growing buying pressure against a ceiling price. Essentially, sellers push prices down to the same level, but buyers become bolder, refusing to let prices fall as low as before.
In the Nigerian stock market, imagine a share price stuck at ₦150 for several trading sessions but bouncing up from ₦130 to ₦140 over time. This tightening range hints at a possible breakout once buying momentum overpowers the resistance.

Prices in an Ascending Triangle generally stay squeezed between support and resistance until a breakout happens, usually upward. Volume often increases during the breakout confirming stronger demand. In Nigeria’s forex market, this pattern sometimes emerges on the USD/NGN pair during stable periods before a surge or devaluation.
Traders watch for a daily close above resistance with volume spike as a signal to go long. Ignoring this can mean missing out on a rally or entering too early during consolidation.
The Cup and Handle shape looks like a shallow bowl (the cup) followed by a small dip or sideways move (the handle). The cup forms over weeks or months, reflecting steady accumulation before a short pause or slight pullback—the handle.
For example, a company’s share price could drop from ₦200 to ₦170, gradually climb back to ₦200 forming the cup, and then drop lightly to ₦190, creating the handle. Recognising this shape hints the market is setting up for an upward move.
The trading signal comes when price breaks above the handle’s resistance, ideally with increased volume. This breakout suggests renewed buying interest after a brief rest.
In the Nigerian Exchange (NGX), this pattern can be particularly useful during stable economic phases when stock prices consolidate after initial dips before surging again. Using stop-loss just below the handle ensures risk is well managed.
A Double Bottom appears as two distinct troughs at roughly the same price level, resembling a “W”. This pattern shows strong support where price refuses to fall lower despite two attempts.
Consider a scenario where a Nigerian bank’s stock dips to ₦50 twice but rallies back each time. This signals a potential reversal from downtrend to uptrend.
Traders often wait for price to rise above the peak between the two bottoms before entering. This confirms buyers have gained control. Entering too early might expose you to continued decline if the pattern fails.
In practical terms, watching volume increase at the bounce points plus a breakout above the middle peak increase confidence that a sustained upward move is starting.
This pattern features three lows with the middle one (the head) lower than the two sides (the shoulders), creating an inverted shape. It’s a classic reversal pattern signalling a sell-off may be ending.
In Nigerian stocks with volatility, such as oil and gas shares, you might see prices dip sharply, recover, dip lower, then rise again forming an inverted head and shoulders before breaking above the neckline—the resistance line joining the two shoulders.
This pattern tends to be reliable because it reflects a shift in market sentiment from strong selling to buying appetite. However, local market factors like low liquidity or delayed information flow might delay confirmation.
That said, seeing volume rise during the breakout enhances the pattern’s validity. Traders in Nigerian contexts should combine this pattern with other confirmations like support levels or volume spikes to avoid false signals common in volatile conditions.
Knowing these patterns helps you navigate the ups and downs of Nigerian markets with greater confidence and timing. They serve as practical tools, cutting through noise so your trading decisions have clearer direction.
By mastering the Ascending Triangle, Cup and Handle, Double Bottom, and Inverted Head and Shoulders patterns, you can better spot moments when price is likely to climb and act accordingly. This gives you an edge whether trading stocks, forex, or commodities domestically.
Understanding bullish chart patterns is useful, but interpreting them properly within the Nigerian market's unique conditions makes a big difference. The local stock and forex scene behaves differently than global markets due to factors like currency volatility, regulatory changes, and economic events. Knowing how to adjust your analysis for these realities can help you avoid false signals and spot better entry points.
The Nigerian financial market often shows rapid price swings, especially during periods of naira instability or government policy announcements. For instance, sudden changes in the Central Bank of Nigeria (CBN) monetary policy or forex restrictions can trigger sharp moves unrelated to usual chart patterns. Traders must therefore adapt by allowing a wider margin for price fluctuations when identifying bullish patterns.
Volume trends also differ — local markets may not exhibit consistently high trading volumes. So, a pattern confirmed by modest volume gains could still hold value, unlike in more liquid markets where volume spikes are crucial. This means Nigerian traders should combine pattern identification with other indicators like relative strength index (RSI), rather than relying solely on volume.
Consider the 2023 recovery rally in Dangote Cement shares. The stock formed a clear ascending triangle pattern after a sell-off, signalling that buyers were gaining control. Despite occasional setbacks from exchange rate pressures, the breakout eventually happened, offering a solid buying opportunity. Traders who ignored local volatility and stuck to rigid pattern rules might have missed this.
On the forex side, the USD/NGN pair often forms bullish double bottoms around certain levels, such as ₦460/USD during periods of CBN intervention. Recognising this pattern helped some forex traders anticipate temporary rebounds amidst longer-term depreciation.
Interpreting these bullish signals with local context in mind makes your trading strategy more adaptive and realistic — essential for navigating Nigeria’s financial markets.
By considering local volatility and using real examples, you better understand how to trust bullish chart patterns without being caught out by Nigeria's market quirks. For traders, investors, and analysts working with Nigerian stocks or forex, this approach boosts confidence and improves timing for profitable trades.
Bullish chart patterns provide useful signals for traders looking to capitalise on upward price movements. However, relying on these patterns alone can be risky, especially in the Nigerian market, which is known for its volatility and sudden shifts due to economic or political events. Combining bullish patterns with other technical analysis tools helps confirm signals, reduce false alarms, and improve overall trading decisions.
Volume analysis is a crucial complement to bullish chart patterns. When a pattern like the ascending triangle or double bottom forms, trading volume often validates the strength of the breakout. For example, in the Nigerian Stock Exchange (NGX), a surge in volume accompanying a breakout above resistance usually confirms genuine buyer interest. Without increased volume, a breakout might be a false signal, often followed by price reversal.
Traders should observe volume trends preceding and during the pattern’s breakout phase. For instance, Union Bank shares might show low volume consolidating within a cup and handle but then spike sharply as it breaks above the handle resistance. That volume spike suggests sustained buying, boosting confidence in entering a trade.
Support and resistance levels frame bullish patterns and help pinpoint entry and exit points. In Nigerian markets, where price swings can be sharp, these levels offer a practical way to define where the market might pause or reverse.
Take the double bottom pattern on Guaranty Trust Bank (GTBank) shares as an example. The two lows form near a clear support level, while the peak between them acts as immediate resistance. Waiting for price to break above this resistance increases the chance of a successful trade. Moreover, support levels can serve as stop-loss points to protect against unexpected downturns.
Combining bullish patterns with these horizontal levels ensures traders are not chasing false breakouts or entering too early, which could be costly in an unstable market.
No analysis tool guarantees profit, so risk management remains essential when trading bullish patterns. This usually involves setting strict stop-loss orders below key support levels or pattern lows to limit losses if the trade fails.
For Nigerian traders prepared for occasional power outages or slow internet, using stop-loss orders linked to trusted trading platforms like MTN's SmartCash or Access Bank’s mobile app helps automate risk controls. Position sizing should align with your overall capital and risk appetite, ideally risking no more than 1-2% of your trading fund on a single trade.
Another practical approach is to combine pattern recognition with fundamental factors, such as corporate earnings from companies like Dangote Cement or macroeconomic news impacting the Naira. That way, technical setups supported by solid fundamentals reduce the chances of surprises.
Successful trading in Nigerian markets requires blending chart patterns with volume signals, price barriers, and solid risk controls. This multi-layered approach ensures you don’t gamble blindly but base your trades on robust evidence and prepared safeguards.
📊 Discover how forex chart patterns work in Nigeria's market! Learn to spot trends, manage risks, and use handy PDFs for confident trading moves. ₦ gains await!

📈 Learn how reversal chart patterns signal price trend shifts in trading. Spot these patterns easily and boost your strategy for smart market moves in Nigeria and beyond.
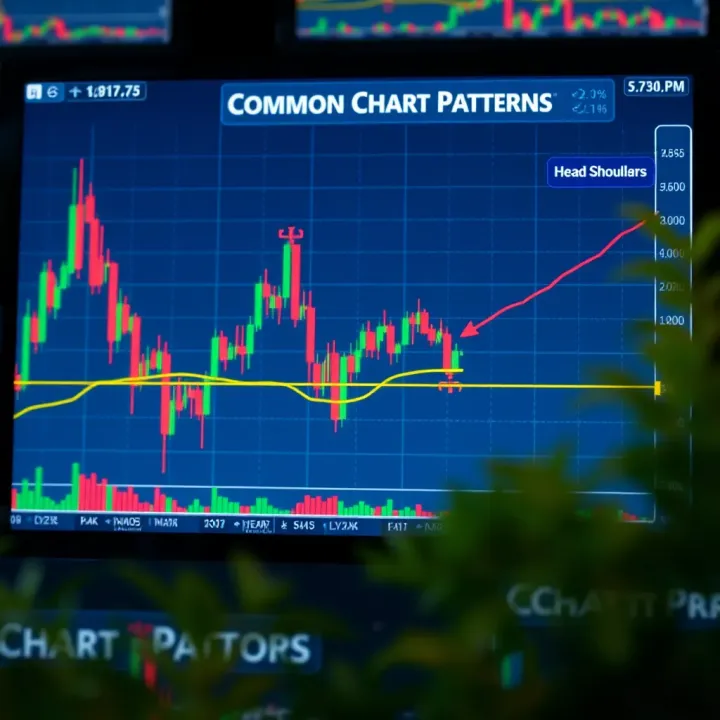
📈 Discover how to spot key chart patterns for savvy trading📊 Access trusted free PDF downloads that Nigerian investors use to sharpen market skills effectively.

Explore the gender binary's historical origins, its limits for non-binary Nigerians, plus evolving views on gender diversity and inclusion 🇳🇬🌍.
Based on 14 reviews